LTPS Web Interface shows some actual system statistics on the System Health page:
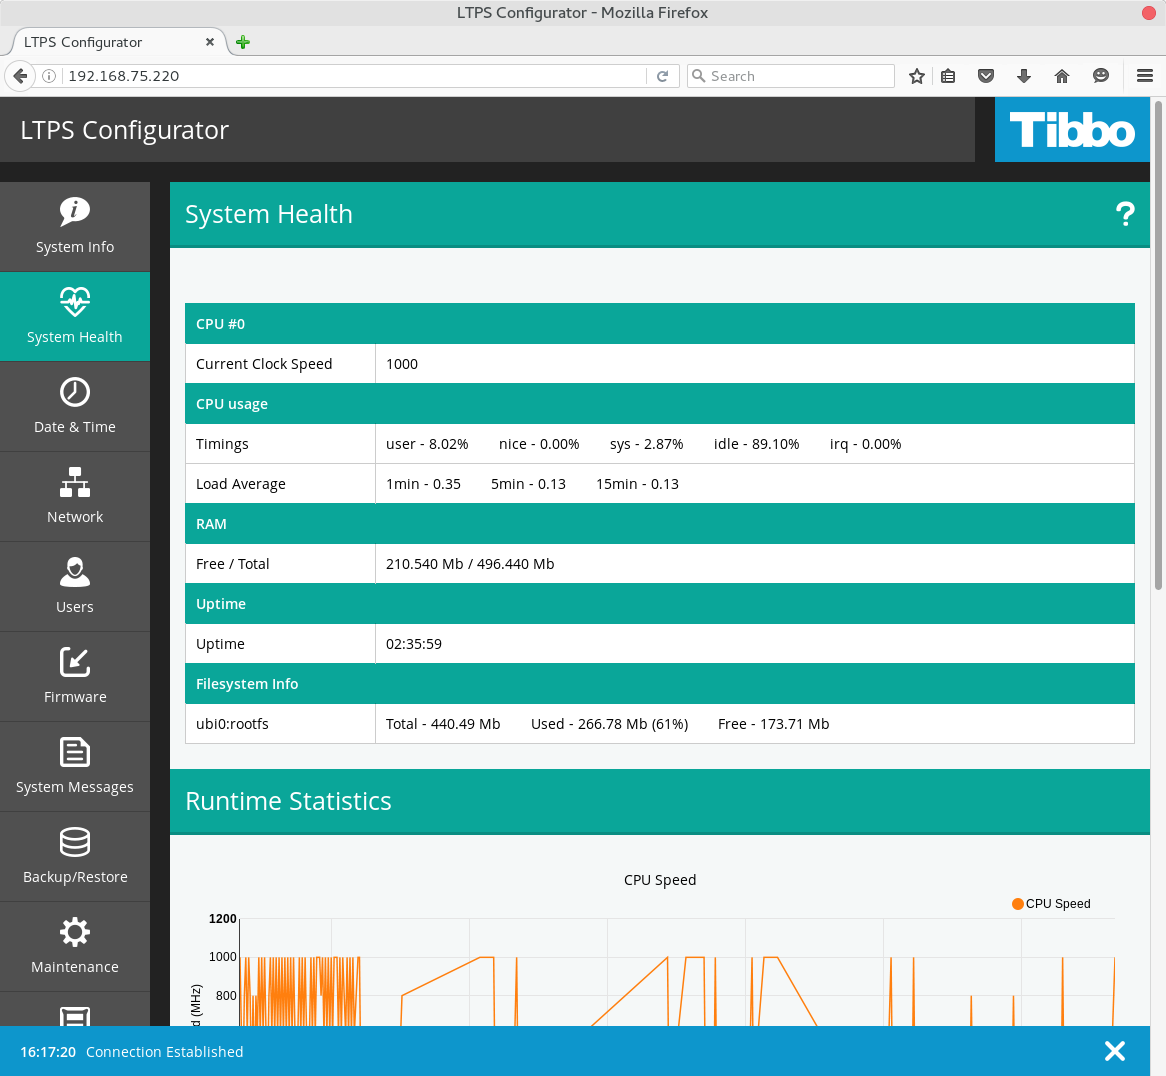
Current CPU speed and load, RAM usage, uptime and system storage
monitoring is available.
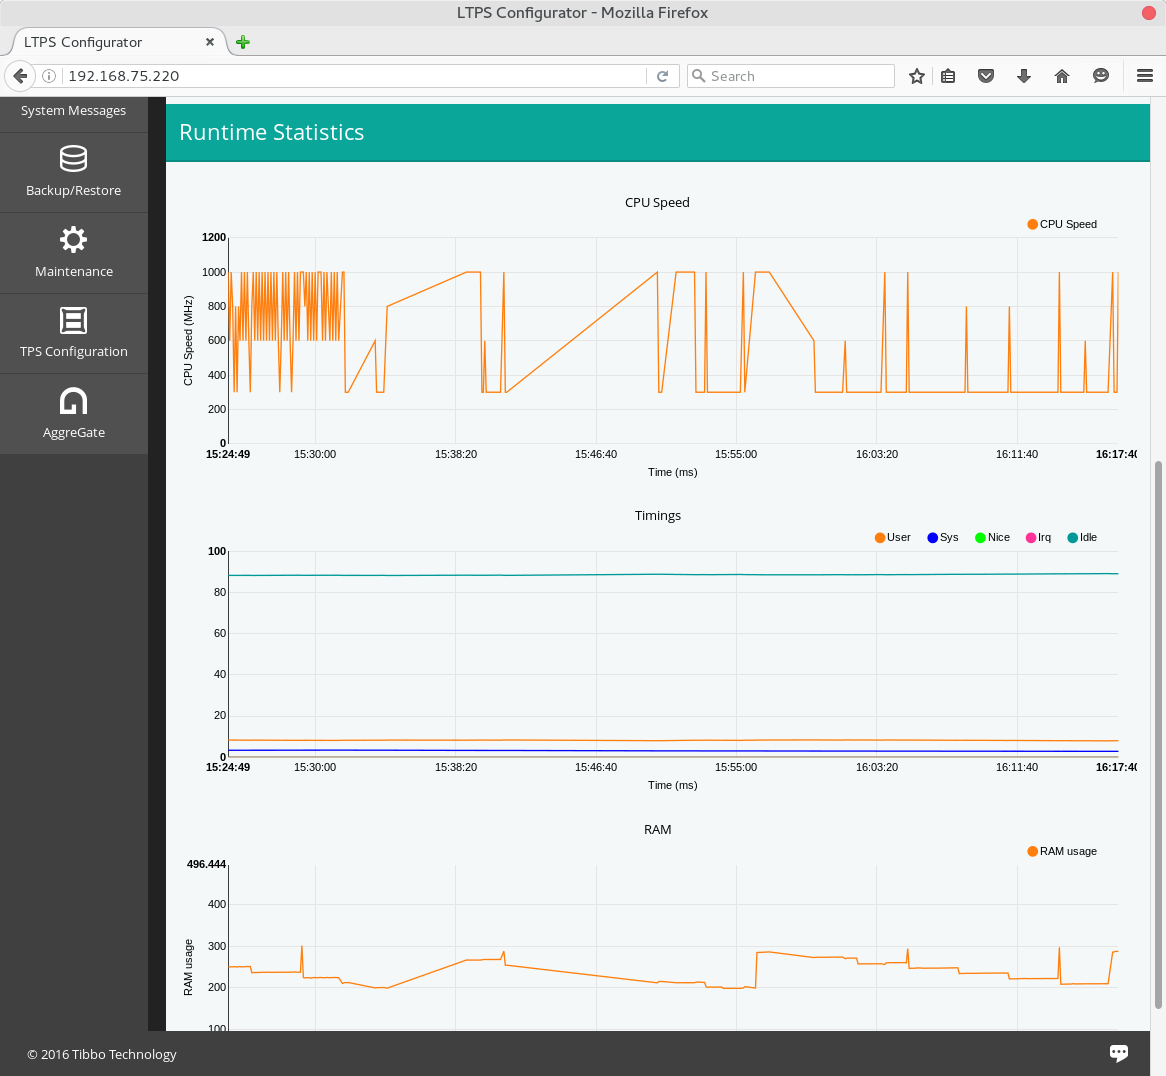
Some runtime data is represented in charts with 30 minutes history:
To view system logs, open LTPS Web Interface and click System Messages menu item:
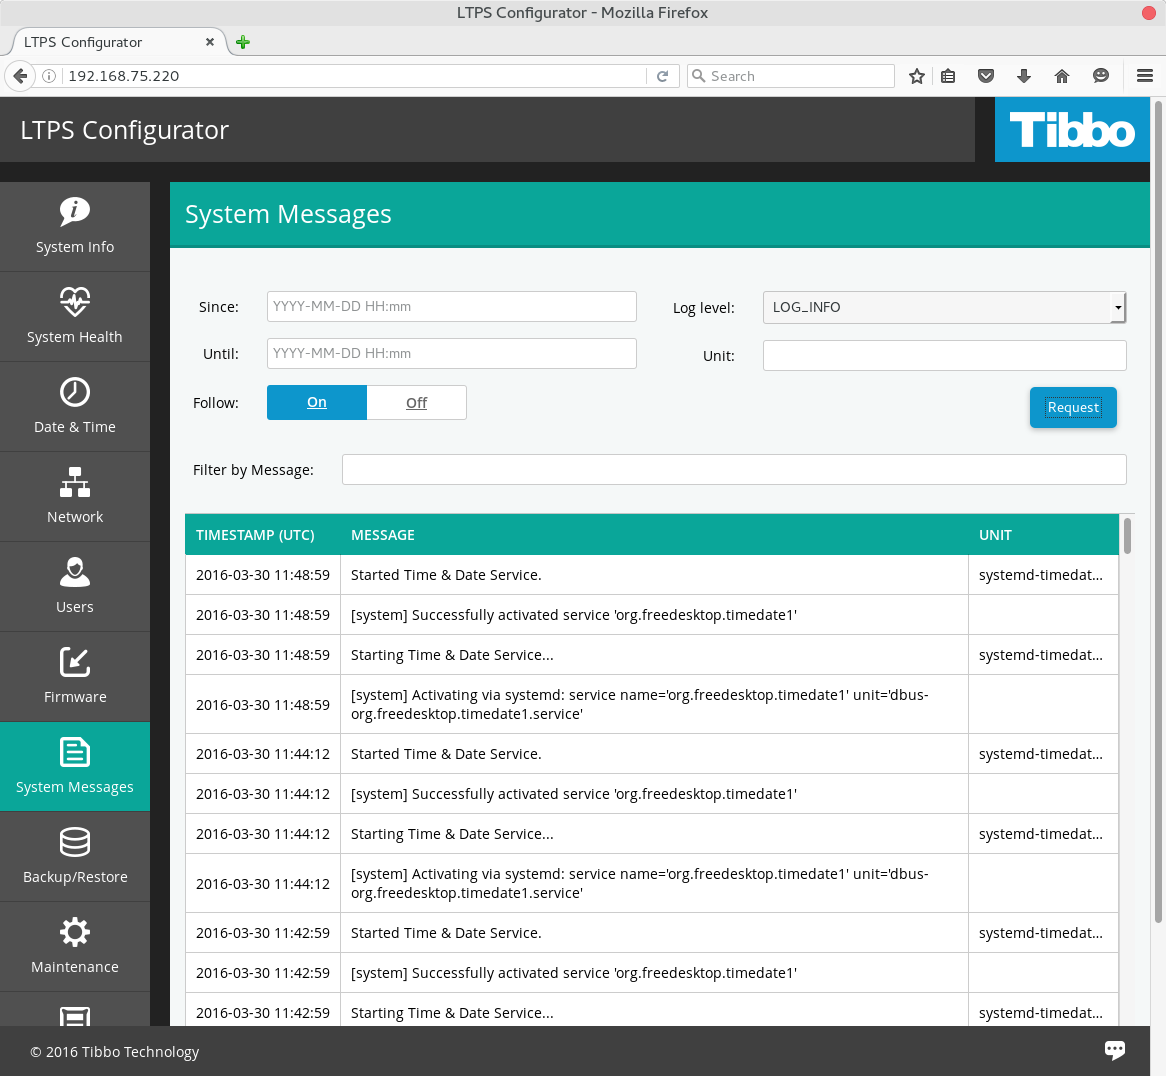
You can filter system logs by keywords, date/time, levels and units (e.g. "ag_server", "tps-agent").